Succeeding in the stock market is based on accurate data and analysis. For traders, stock market live charts are of particular importance. These charts can help you understand the movements of the market and make strategic decisions. In this article, you will learn how to invest effectively with stock market live charts and how to shape your strategies.
Main Points
- What are stock market live charts and how to use them?
- Developing strategies for investors.
- Methods for analyzing market trends.

Basics of Stock Market Live Charts: What Investors Need to Know
The stock market is a dynamic market that offers both opportunities and risks for investors. Therefore, understanding the basic concepts of the stock market is one of the first steps to becoming a successful trader. Live charts are tools that help us better grasp these concepts. Here are some basic concepts that are frequently encountered on stock market live charts:
1. Price Chart
A price chart shows the price changes of a particular asset over time. Traders analyze market trends on price charts. These trends offer clues about how future prices may change.
2. Candle Chart
A candlestick chart is a type of chart that shows the opening, closing, highest and lowest prices over a given time period (e.g. daily, weekly). Each candle determines the price movements on that timeframe and is an important analysis tool for traders.
3. Support and Resistance Levels
Support levels are the specific price limits that an asset’s price often encounters when it starts to fall. Resistance levels are the limits or resistance points that the price encounters when it starts to rise. These levels are critical points that affect investors’ trading decisions.
4. Volume
Trading volume on the stock exchange refers to the total amount of trading that takes place in a given period of time. Volume plays an important role in assessing the strength of investments. High volume can signal increased investor interest in a particular asset.
5. Indicators and Oscillators
In the stock market, there are many indicators and oscillators used in technical analysis. These tools help to determine the trajectory of price movements and analyze market psychology. Commonly used indicators include RSI (Relative Strength Index) and MACD (Moving Average Convergence-Divergence).
- S/R (Support/Resistance): Points where prices frequently stall.
- Trend Lines: Lines that determine the direction of market movements.
- Volatility: It shows how drastic price changes are.
These are the basic concepts that traders need to know in order to analyze stock market live charts more effectively. Today, knowledge about the stock market has become essential for making successful investment decisions. In this context, it will be beneficial for investors to improve themselves in chart analysis in order to evaluate the opportunities in the market.

Investment Strategies with Live Charts: Effective Methods in Market Analysis
The investment world is full of uncertainty and opportunity. In order to be successful in this field, it is necessary to use effective analysis methods. Live charts play a critical role in trading strategies. The use of these charts is essential for tracking market activity and predicting future trends.
The Importance of Live Graphics
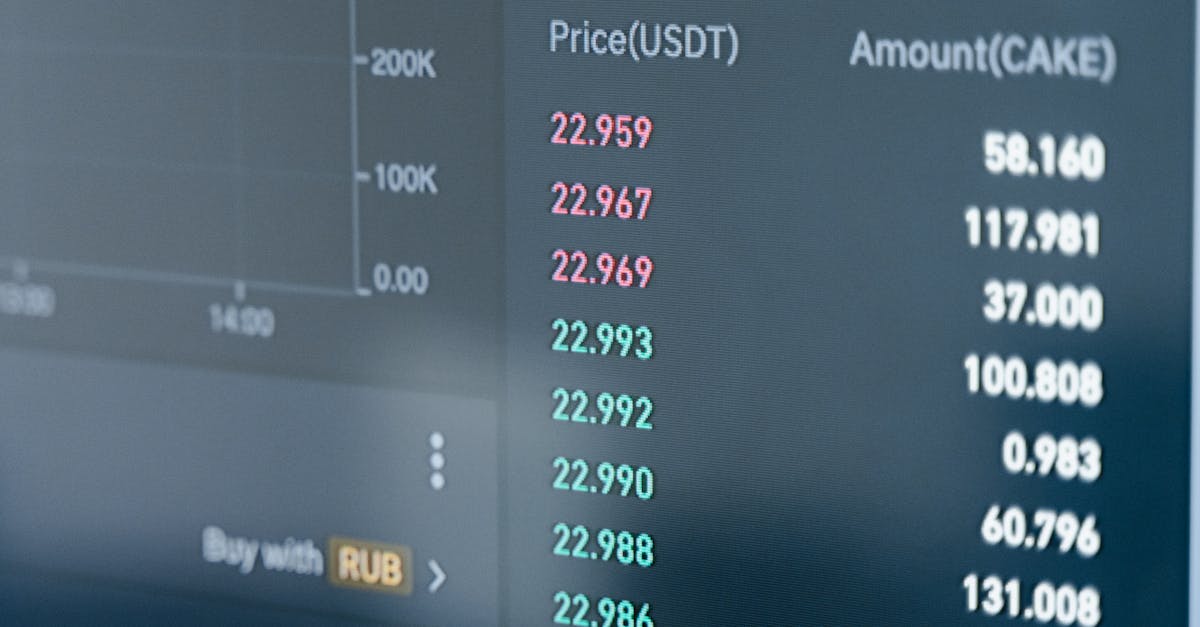
Live charts allow traders to monitor market movements in real time. These charts reflect price fluctuations, volume changes and other key indicators. For investors, this information is vital to make qualified decisions. Especially in today’s fast-changing market conditions, access to instant data provides a strategic advantage.
Investment Strategies and Chart Usage
Investment strategies are based on specific analysis methods. With live charts, these strategies become more concrete. For example, having information about support and resistance levels can guide buying and selling decisions. In addition, trend analysis can be done with the help of charts. However, there are a few important points to note here.
| Graphic Type | Description |
|---|---|
| Line Chart | Shows price changes over time. |
| Bar Chart | Shows opening, closing, high and low prices. |
| Candle Chart | Shows price movements in more detail. Widely used for trading decisions. |
Analyzing graphs can be misleading. Sometimes, we may not see a certain pattern or we may miss an important piece of data. That’s why it’s important to use other methods of analysis alongside the charts. Trading strategies based on live charts can be incomplete if technical analysis is not supported by methods such as fundamental analysis.
Continually Evolving Technology and Football
Technology plays a big role in market analysis. Today, traders analyze not only with charts, but also with algorithmic trading systems and artificial intelligence. However, no matter how sophisticated these tools are, it is just as important for investors to develop their own thinking and strategies. Moreover, market fluctuations should not only be analyzed in terms of technical indicators, but also in relation to global economic developments.
In conclusion, live charts and effective trading strategies are indispensable tools for successful market analysis. However, the effective use of these tools requires in-depth knowledge, experience and discipline. Balancing in a world full of uncertainties is possible only by unraveling the complexity behind many seemingly simple decisions of will and hope.

Stock Market Live Chart Analysis: Usage Tactics of Successful Traders
The stock market offers both wealth and risk opportunities for investors. However, in order to take advantage of these opportunities, the right analysis methods are needed. This is where live chart analysis comes in. Successful traders use the data from these charts to support their decision-making. So what are the methods and tactics behind these analyses?
What is Live Graphics and Why is it Important?
A live chart is a tool that displays stock market data in real time. These charts allow the trader to see market movements in real time. However, simply watching a chart is not enough. The ability to read charts is critical to the success of a trade. Many traders start by observing chart data. However, understanding what this data means is another skill.
Determining Tactics
Successful traders employ certain tactics when working with live charts. First of all, these traders do not neglect trend analysis. Trends are crucial for understanding the direction of the market. If an asset is in an uptrend, investors may prefer to take more risk. On the other hand, it is useful to act with caution in downtrends.
Secondly, they focus on support and resistance levels. These levels are specific price points and help predict how prices will move. Support levels are the points where the price can hold when it is falling, while resistance levels are the obstacles that the price faces when it is trying to rise again. Accordingly, these levels should be carefully monitored.
Other Aspects to Observe
A third element to consider in live chart analysis is indicators. Indicators are mathematical calculations used to analyze market trends. For example, indicators such as moving averages and RSI support traders’ trading decisions. However, it is important to note that indicators can be misleading. Investors should not be overly dependent on these indicators.
In conclusion, stock market live chart analysis is an indispensable part of any successful trader. This analysis creates an accurate information base and shapes investment decisions. However, reading and correctly interpreting these charts also requires a special skill. The most important thing to keep in mind when investing is to always act with knowledge and strategy. Therefore, charts should be taken into account, but emotional decisions should not be made.
Conclusion
In conclusion, it is a fact that we need up-to-date data when making decisions about the stock market. Live charts are one of the most effective ways to get these insights. Observing the movements in the markets in real time is crucial for traders to shape their strategies. In addition, these charts make it possible to take advantage of opportunities that may arise in a timely manner. In other words, it is vital to follow such resources in order to stay active in the stock market. After all, using information in the right way is the key to making gains.
Frequently Asked Questions
How to use stock market live charts?
Stock market live charts are used to monitor stock price movements in real time. Traders can make trading decisions by analyzing price changes, support and resistance levels on the charts.
What data is included in live charts?
Live charts usually include fundamental data such as price, volume, highs and lows. In addition, indicators used for technical analysis can also be found on the charts.
Where can I access live stock market charts?
Live stock market charts are usually available on the websites or mobile apps of the brokerage firms you are trading with. Financial news websites and stock exchange platforms also offer live charting services.
 Anasayfa
 Canlı Borsa
 Borsa
Borsa Döviz Kurları
 Altın
Altın Hisse Senetleri
 Endeksler
 Kripto Paralar
 Döviz Hesaplama
 Döviz Çevirici
 Kredi Arama

 News
News


